![]()
![]()
![]()
![]()
![]()
![]()
![]()
![]()
![]()

Spreadsheets 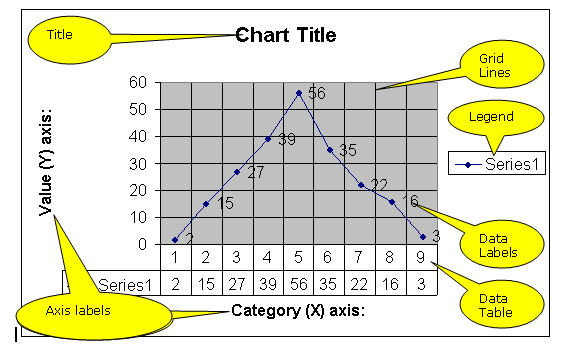
One of the most commonly used things in a spreadsheet is graph and chart drawing. A wide variety of charts and graph styles are possible. Unfortunately although Excel charts can be very pretty Excel is a general purpose package and its graph drawing does not always offer sufficiently sophisticated features for some mathematical and scientific work. A more specialized package may be used for this purpose. Autograph is used in some schools for this purpose.
In Excel (and most other spreadsheets) a wizard will take you through the graph creation process. So there is no point in describing that here; other than to say that you start with the menu options " INSERT CHART ". Students are often unfamiliar with the names Excel uses for the parts of a chart so here is a chart with the parts labeled:
![]()
If and when you want to modify a chart click on it and the chart menu will appear. This is intuitive if you hover the mouse over the buttons the tool tips tell you what each one does. If you wish to reuse the wizard pages these are available by right clicking on the chart. The first four options (chart type, source data, chart options and location) are the four pages of the wizard.
© LEV